Tracking tool for transport of dangerous goods
Year: 2018
My role: UX/UI designer
Company: This project was developed with Undanet for the ETSA company.
Team: This project was developed with a diverse team, including a project owner, back-end developers and front-end developers. We initially collaborated on the conception and information architecture stages. Later in the development of the project I also worked with the front-ends to validate the UI.
The transportation company ETSA, specialising in the transport of dangerous goods, required a solution to manage and track the real-time activities of their trucks and drivers on a map. This project involved a lot of data and several entities, and our team was hired to develop a responsive application that would solve their problems and fulfill their needs and requirements.
1. The discovery : interview with the client and a representative of the end-users and definition of the specifications.
2. Architecture definition : definition of the Entity-Relationship diagram and the user journey.
3. First mockups and feedback from the client.
4. Final solution.
First, the project owner, the development leader of the project and I met the client who presented the project. We asked many questions in order to better understand the nature and constraints of the transportation activity and discussed further the client’s needs and wishes.

A portal for Admins to register and manage users, vehicles, drivers and alerts.
Application accessible in 2 languages: English and Spanish
To be used mainly on desktop and on mobile by out of the office on-duty workers.
Looking at the specifications we realized that the complexity of the project would be substantial, since we had a lof of data to work with.
We needed to organise and categorise all the data we had, not only for the developers to create the back-end of the software, but for all of the team members to better understand all the content to visualize in the designs and the relations between the different classes or categories. Then we created the E-R diagram.

Once the E-R Diagram was created, the information started to look clearer so with the project owner, we created the user flow.

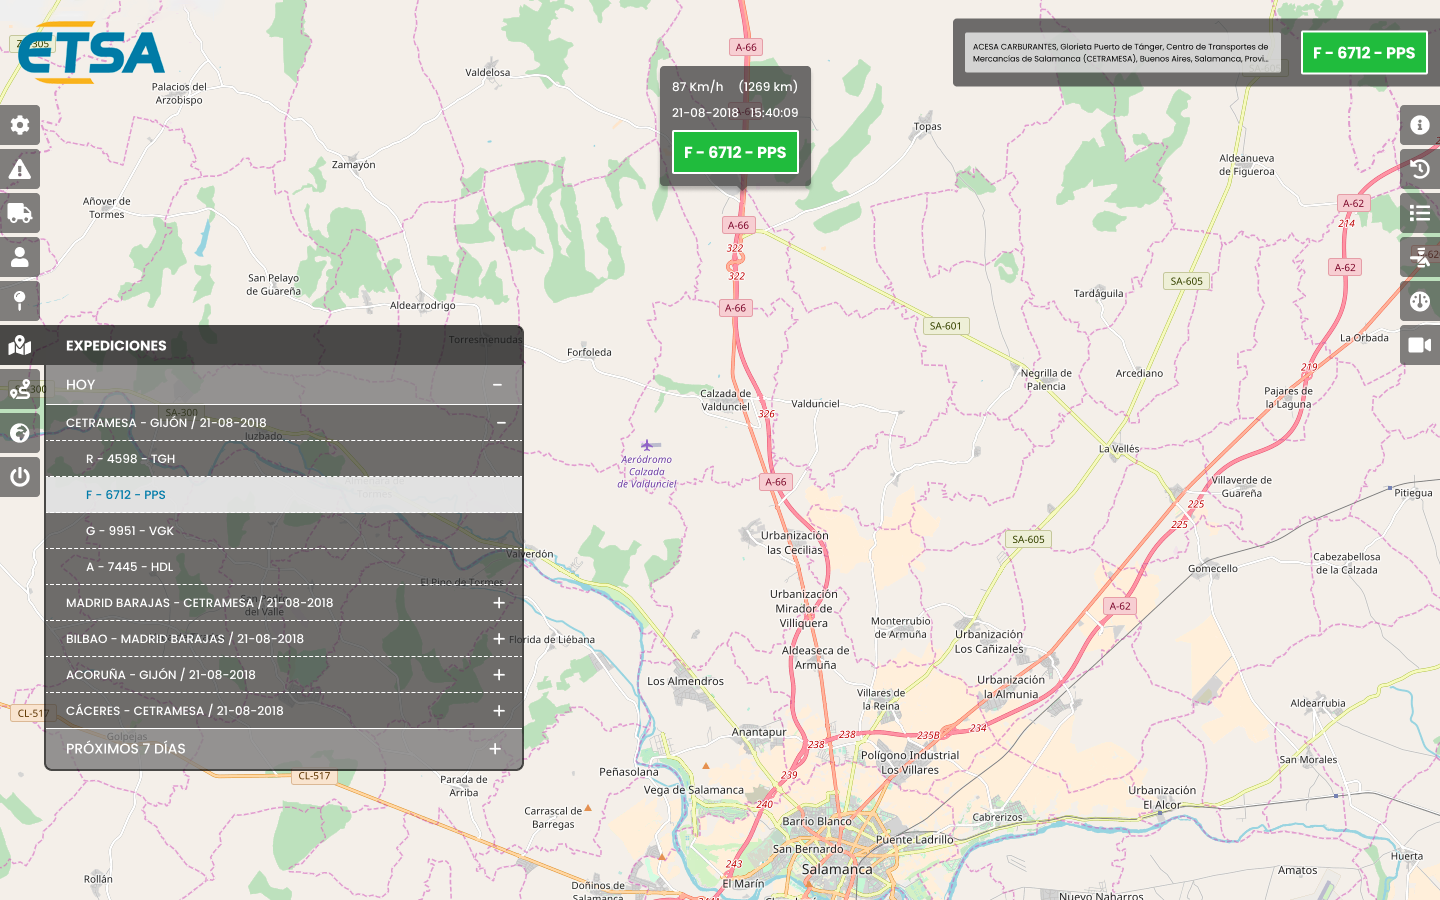
The user journey was the base to create some low-fi mockups. We shared these wireframes with the client and he returned some interesting feedback. The main concern was about the visualization of the map, even if the information needed to be displayed, the whole map should be visible all the time (but on the admin features). This was a little challenging, as I needed to think on how to display all the information without hiding anything else.
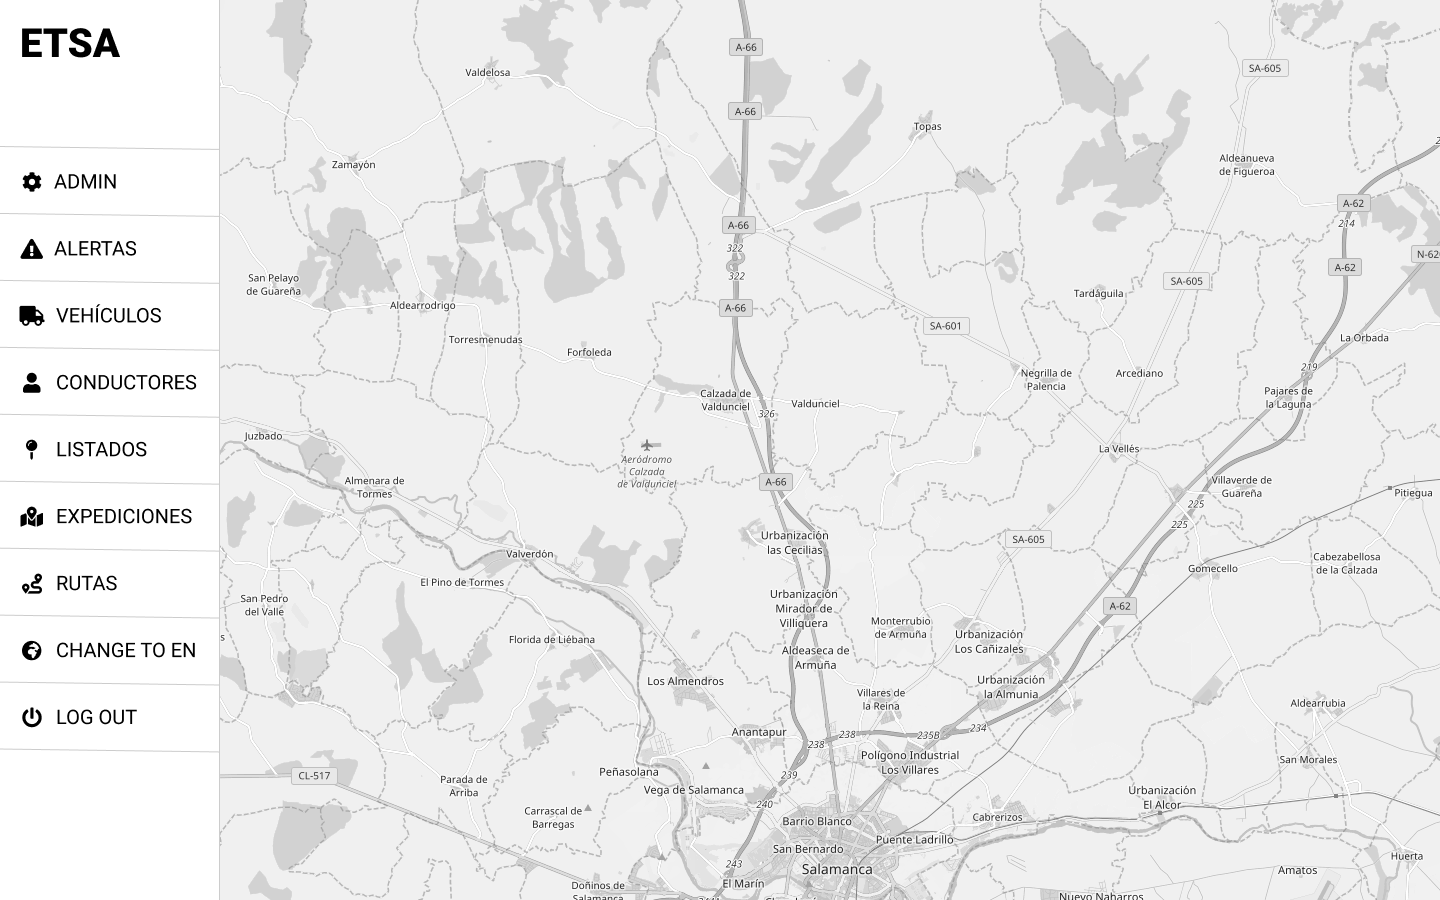

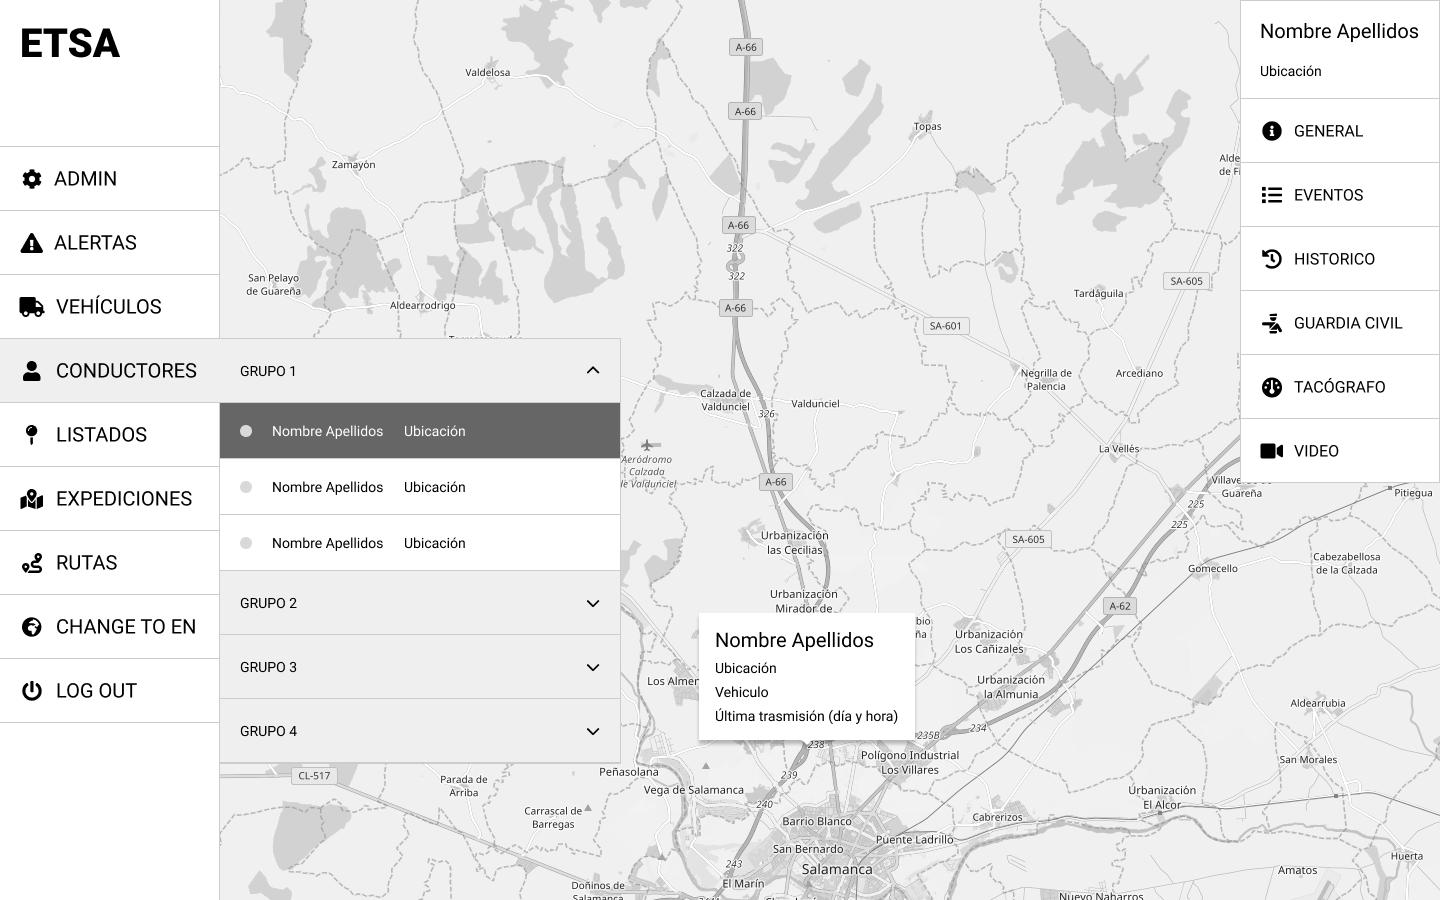


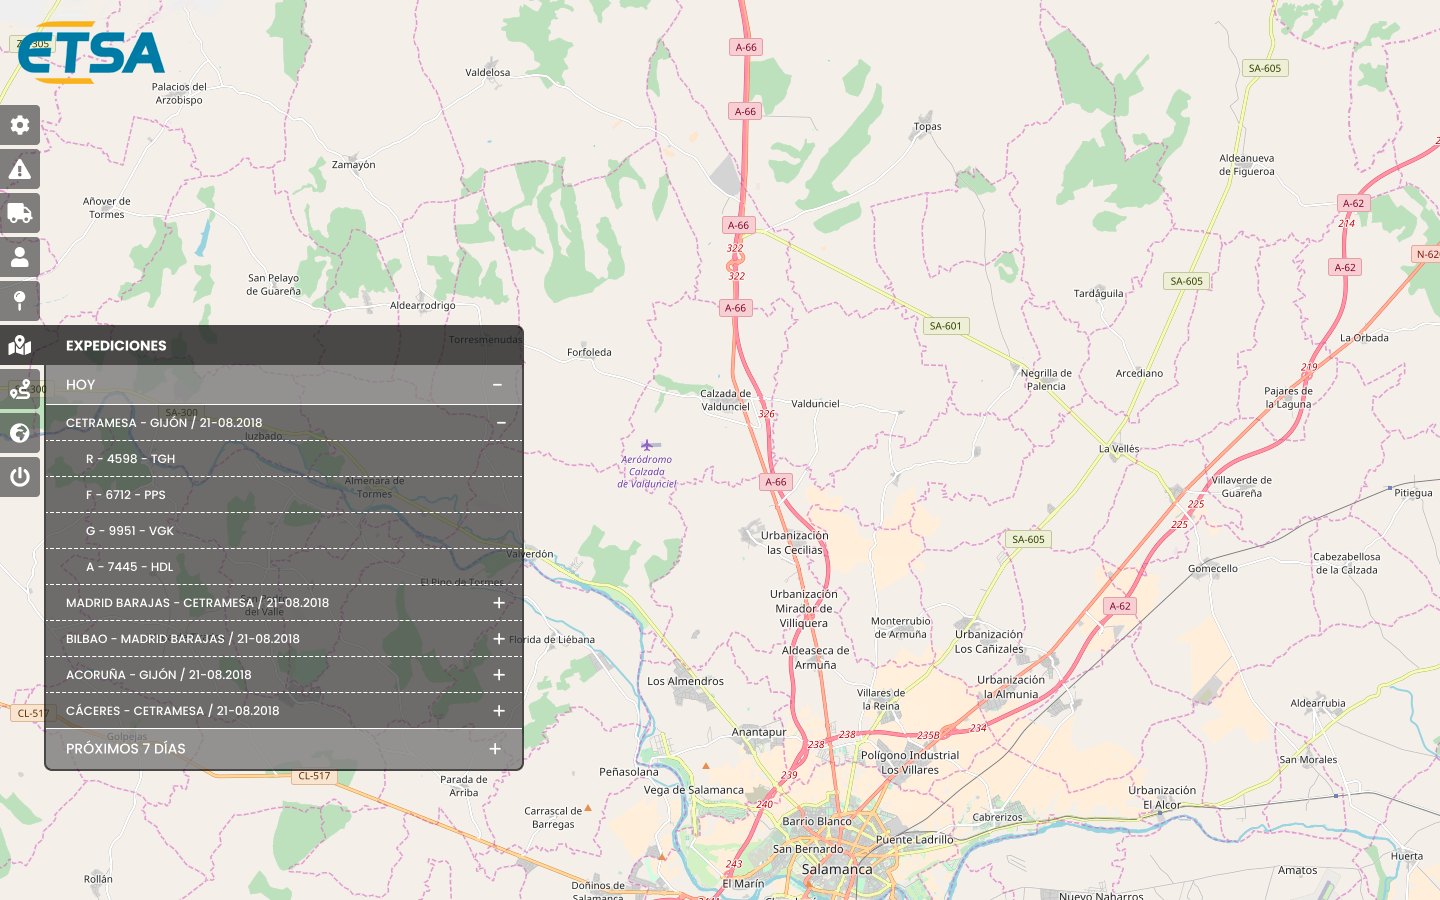
I needed to find a solution to ensure the map remained visible while displaying additional data, and the best solution was using transparencies. I did some drafts, by showing the data on a non opaque dark background the user could still see the overlaid portions of the map.
Mobile adaptation wasn’t easy. There was a lot of information and the client needed to keep it all in mobile so the workers could check any data during their on-duty out of the office. However, the usage of mobile devices was very reduced, so we could simplify the views to lighten up the content on the screen.
I validated the solution with the client and, as they were very satisfied, I could design the final wireframes for all the different user stories.


Finally, with all the designs done I proceed to write a handbook for new workers formation on the application, also required for the project by the client.
The ETSA Location project entailed quite a complexity, there was a lot of data to understand and visualize, and a lot of functionalities related to the different elements to manage. Nevertheless, we planned the project carefully to understand the information, the needs and the constraints concerned, and we looked for the best solution for each problem.
Finally, the client was more than satisfied with the application and especially with the usability of it, which was even better than they had expected.
© 2023 AARDesign. All rights reserved.
